Nonwhite Crime Apocalypse Envelops New York City
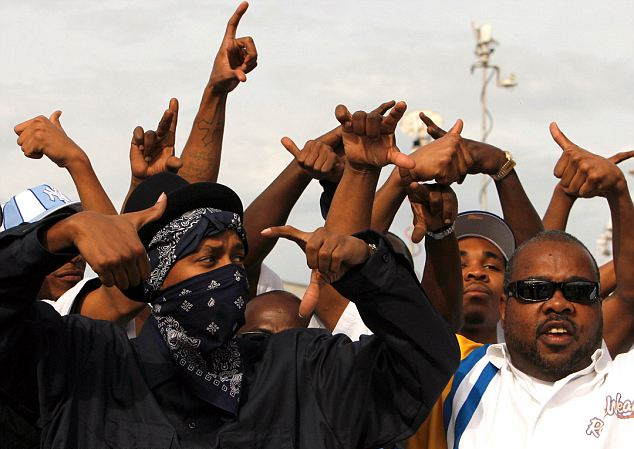 New York City, once America’s greatest and most famous metropolis, is now a crime-ridden hell.
Where nonwhites commit 95% of all murders, 90% of all rapes, 90% of Felony Sex Crimes, 96% of all robberies, 91% of all Felonious Assaults, 90% of all Grand Larceny offenses, 86% of all Misdemeanor Sex Crimes, 90% of all Misdemeanor Assault and Related offenses, 87% of all Petit Larceny offenses, 84% of all Misdemeanor Criminal Mischief offenses, 96.6% of all Shooting offenses, and constitute 90.8% of all firearm arrests, 86.3% of all Drug Felony arrests, 82.3% of all Felony Stolen Property arrests, and 94.5% of all Felony and Misdemeanor Complaint Records with Identified Juvenile Victims, Suspects and Arrestees—all this according to official figures released by the New York City Police Department.
The figures, contained in the latest “Crime and Enforcement Activity in New York City” report issued by the NYPD, which covers the dates January 1 to June 30, 2013, can be found on the New York Government website here (PDF).
The high nonwhite crime rates have been consistently growing over the past few years, as the previous NYDP reports have shown (all available reports can be found here).
The “White” statistics are, of course, distorted, as the authorities classify Middle Easterners, Arabs and others as “white” or “Caucasian” as well, in line with Federal guidelines.
Once this erroneous classification is removed from the equation, the “White” crime rate will be even lower than stated.
The crime statistics as detailed by the report:
Murder and Non-Negligent Manslaughter
Murder and Non-Negligent Manslaughter victims are most frequently Black (63.8%) or Hispanic (23.7%). White victims account for (8.6%) of all Murder and Non-Negligent Manslaughter victims while Asian /Pacific Islanders account for (3.9%) of all Murder and Non-Negligent Manslaughter victims.
The race/ethnicity of known Murder and Non-Negligent Manslaughter suspects mirrors the victim population with Black (57.0%) and Hispanic (35.5%) suspects accounting for the majority of suspects. White suspects account for (5.0%) of all Murder and Non-Negligent Manslaughter suspects while Asian/Pacific Islanders accounted for (2.5%) of the known Murder and Non-Negligent Manslaughter suspects.
The Murder and Non-Negligent Manslaughter arrest population is similarly distributed. Black arrestees (58.4%) and Hispanic arrestees (30.7%) account for the majority of Murder and Non-Negligent Manslaughter arrestees while White arrestees (8.8%) and Asian/Pacific Islander (1.5%) arrestees account for the remaining portions of the Murder and Non-Negligent Manslaughter arrest population.
Rape
Rape victims are most frequently Black (40.4%) or Hispanic (35.2%). White victims account for (18.1%) of all Rape victims while Asian/Pacific Islanders account for (5.7%) of all Rape Victims.
Rape suspects are most frequently Black (50.6%) or Hispanic (35.4%). White suspects account for (10.5%) of all Rape suspects while Asian/Pacific Islanders accounted for (2.7%) of the known Rape suspects.
Rape arrestees are most frequently Black (45.5%) and Hispanic (44.7%). White arrestees (4.8%) and Asian/Pacific Islander arrestees (4.8%) account for the remaining portions of the Rape arrestee population.
Other Felony Sex Crimes
Other Felony Sex Crime victims are most frequently Black (37.2%) or Hispanic (36.4%). White victims account for (21.3%) of all Other Felony Sex Crime victims while Asian/Pacific Islanders account for (5.1%) of the Other Felony Sex Crime Victims.
Known Other Felony Sex Crime suspects are most frequently Black (47.8%) or Hispanic (35.0%). White suspects account for (10.6%) of all Other Felony Sex Crime suspects while Asian/Pacific Islanders accounted for (5.8%) of known Other Felony Sex Crime suspects.
Hispanic arrestees are the largest portion of the Other Felony Sex Crime arrest population (49.2%) followed by Black arrestees who account for (37.9%) of the arrest population. White arrestees (8.7%) and Asian /Pacific Islander (4.2%) arrestees account for the remaining significant portions of the Other Felony Sex Crime arrest population.
Robbery
Robbery victims are most frequently Hispanic (37.2%) or Black (33.1%). White victims account for (16.5%) of all Robbery victims while Asian/Pacific Islanders account for (12.2%) of all Robbery Victims.
The race/ethnicity of known Robbery suspects is primarily Black (68.7%). Hispanic suspects account for an additional (25.8%) of the suspect population. White suspects account for (4.1%) of all Robbery suspects while Asian /Pacific Islanders accounted for (1.3%) of known Robbery suspects.
The Robbery arrestees are most frequently Black (63.2%) or Hispanic (28.4%). White arrestees (5.3%) and Asian/Pacific Islander (3.0%) arrestees account for the remaining portions of the Robbery arrest population.
Felonious Assault
Felonious Assault victims are most frequently Black (46.1%) or Hispanic (34.7%). White victims account for (13.3%) of all Felonious Assault victims while Asian/Pacific Islanders account for (5.6%) of all Felonious Assault Victims.
The race/ethnicity of known Felonious Assault suspects is most frequently Black (54.9%) or Hispanic (31.8%). White suspects account for (9.3%) of all Felonious Assault suspects while Asian/Pacific Islanders accounted for (3.7%) of the known Felonious Assault suspects.
Felonious Assault arrestees are most frequently Black (52.2%) or Hispanic (33.5%). White arrestees (9.3%) and Asian/Pacific Islanders (4.6%) account for the remaining significant portions of the Felonious Assault arrestee population.
Grand Larceny
Grand Larceny victims are most frequently White (41.9%) or Black (24.9%). Hispanic victims account for an additional (20.5%) of all Grand Larceny victims while Asian/Pacific Islanders account for (11.9%) of all Grand Larceny Victims.
The race/ethnicity of known Grand Larceny suspects are most frequently Black (62.1%) or Hispanic (22.7%). White suspects account for (10.5%) of all Grand Larceny suspects while Asian/Pacific Islanders accounted for (4.2%) of the known Grand Larceny suspects.
Grand Larceny arrestees are most frequently Black (50.5%) or Hispanic (29.9%). White arrestees (14.2%) and Asian/Pacific Islanders (5.2%) account for the remaining significant portions of the Grand Larceny arrest population.
Misdemeanor Sex Crime
Misdemeanor Sex Crime victims are most frequently Black (36.5%) or Hispanic (36.4%). White victims account for an additional (19.2%) of all Misdemeanor Sex Crime victims while Asian/Pacific Islanders account for (7.5%) of all Misdemeanor Sex Crime Victims.
Misdemeanor Sex Crime suspects are most frequently Black (43.1%) and Hispanic (35.5%). White suspects account for (14.7%) of all Misdemeanor Sex Crime suspects while Asian/Pacific Islanders accounted for (6.2%) of the known Misdemeanor Sex Crime suspects.
Misdemeanor Sex Crime arrestees are most frequently Black (41.1%) or Hispanic (40.3%). White arrestees (12.2%) and Asian /Pacific Islander (6.0%) arrestees account for the remaining portions of the Misdemeanor Sex Crime arrest population.
Misdemeanor Assault and Related Offenses
Misdemeanor Assault victims are most frequently Black (42.7%) or Hispanic (35.9%). White victims account for an additional (14.4%) of all Misdemeanor Assault victims while Asian/Pacific Islanders account for (6.3%) of the Misdemeanor Assault Victims.
Misdemeanor Assault suspects are most frequently Black (53.9%) or Hispanic (32.3%). White suspects account for an additional (10.1%) of all Misdemeanor Assault suspects while Asian/Pacific Islanders accounted for (3.3%) of the known Misdemeanor Assault suspects.
The Misdemeanor Assault arrest population is similarly distributed. Black arrestees (48.3%) and Hispanic arrestees (36.5%) account for the majority of Misdemeanor Assault arrestees while White arrestees (10.2%) and Asian/Pacific Islander (4.6%) arrestees account for the remaining significant portions of the Misdemeanor Assault arrestee population.
Petit Larceny
Petit Larceny victims are most frequently White (35.8%) or Black (29.5%). Hispanic victims account for (24.4%) of all Petit Larceny victims while Asian/Pacific Islanders account for (9.3%) of all Petit Larceny Victims.
The race/ethnicity of known Petit Larceny suspects are most frequently Black (57.3%) or Hispanic (27.3%). White suspects account for an additional (13.1%) of all Petit Larceny suspects while Asian/Pacific Islanders account for (2.1%) of the known Petit Larceny suspects.
The Petit Larceny arrest population is most frequently Black (45.8%) or Hispanic (35.2%). White arrestees (14.6%) and Asian /Pacific Islander (4.1%) arrestees account for the remaining significant portions of the Petit Larceny arrestee population.
Misdemeanor Criminal Mischief
The Misdemeanor Criminal Mischief victims are most frequently Black (37.0%) or White (27.8%). Hispanic victims account for an additional (26.1%) and Asian/Pacific Islanders (8.3%) account for the remaining significant portion of the Misdemeanor Criminal Mischief Victim population.
Misdemeanor Criminal Mischief suspects are most frequently Black (50.6%) or Hispanic (30.2%). White suspects account for an additional (15.9%) of all Misdemeanor Criminal Mischief suspects while Asian/Pacific Islanders account for (3.0%) of known Misdemeanor Criminal Mischief suspects.
Misdemeanor Criminal Mischief arrestees are most frequently Hispanic (38.0%) or Black (35.0%). White arrestees (22.6%) and Asian/Pacific Islander (4.3%) arrestees account for the remaining significant portions of the Misdemeanor Criminal Mischief arrest population.
Shootings
Shooting victims are most frequently Black (73.9%) or Hispanic (21.5%). White victims account for an additional (2.8%) of all Shooting victims while Asian/Pacific Islanders victims account for (1.8%) of all Shooting Victims.
The race/ethnicity of known Shooting suspects is most frequently Black (74.1%). Hispanic suspects accounted for an additional (21.4%) of all suspects. White suspects (3.4%) accounted for the remaining significant portion of suspects while Asian/Pacific Islander suspects accounted for (1.1%) of the known Shooting suspects.
The Shooting arrest population is similarly distributed. Black arrestees (70.0%) and Hispanic arrestees (25.4%) account for the majority of Shooting arrest population. White arrestees (2.9%) and Asian/Pacific Islander (1.6%) account for the remaining portion of the Shooting arrest population.
Firearm Arrests (satisfying specific selection criteria)
The Firearm Arrest population is most frequently Black (70.2%) or Hispanic (20.0%). White arrestees account for (9.2%) and Asian /Pacific Islanders account for (0.6%) of the total Firearm arrest population.
The Firearm arrest group consists of arrests in which at least one firearm is recovered and the arrestee is charged with a Dangerous Weapons Felony charge. The Dangerous Weapon charge may also be one of many arrest charges lodged, some of which may be for more serious violent felonies. This arrest population therefore overlaps with arrests for other violent crimes that appear in other charts.
Proactive Offenses (Drug Arrests & Allegations)
The Drug Felony Arrest population is most frequently Black (43.5%) or Hispanic (41.1%). White arrestees account for (13.2%) and Asian Pacific Islanders account for (2.1%) of the total Drug Felony arrest population.
The Drug Misdemeanor Arrest population is most frequently Black (48.7%) or Hispanic (35.1%). White arrestees account for (13.7%) and Asian Pacific Islanders account for (2.4%) of the total Drug Misdemeanor arrest population.
Drug Allegations most frequently identify Black (40.8%) and Hispanic (38.0%) suspects. White suspects (15.0%) and Asian/Pacific Islander (4.9%) account for the remaining significant portions of the drug allegation suspects.
Proactive Property Crimes
The Felony Stolen Property Arrest population is most frequently Black (51.2%) or Hispanic (30.2%). White arrestees account for (14.4%) and Asian/Pacific Islanders account for (4.0%) of the total Felony Stolen Property arrest population.
The Misdemeanor Stolen Property Arrest population is most frequently Black (44.4%) or Hispanic (31.8%). White arrestees account for (17.7%) and Asian/Pacific Islanders account for (5.8%) of the total Misdemeanor Stolen Property arrest population.
Violent Crime and Stop Question and Frisk Activity
The most frequently occurring race/ethnic group within the Violent Felony suspects is Black, accounting for (64.0%). Hispanic suspects account for an additional (27.9%) while White and Asian/Pacific Islanders account for (5.8%) and (2.0%) respectively.
The most frequent race/ethnic group within the Stop Question and Frisk subject population is Black, accounting for (55.8%). Hispanic subjects account for an additional (29.6%) while White and Asian/Pacific Islanders account for (10.7%) and (3.5%) of total Stops respectively.
Felony and Misdemeanor Complaint Records with Identified Juvenile Victims, Suspects and Arrestees
Reported crime complaint juvenile victims are most frequently Black (43.5%). and Hispanic (38.5%). White juvenile victims (11.7%) and Asian/Pacific Islander juvenile victims (5.8%) account for the remaining significant portions of all juvenile victims.
Juvenile crime complaint suspects are most frequently Black (67.3%) or Hispanic (25.9%). White suspects account for an additional (5.5%) of the juvenile suspects while Asian/Pacific Islanders accounted for (1.1%) of the juvenile suspects.
The juvenile arrest population is most frequently Black (61.8%) and Hispanic (36.0%). White arrestees (4.1%) and Asian/Pacific Islander arrestees (2.0%) account for the remaining significant portions of the juvenile arrest population.
According to the report, the New York City population is divided as follows by Race/Hispanic Origin (using the Census Bureau 2012: American Community Survey ACS):
“White Non-Hispanic” 2,731,173 33.1%
Black Non-Hispanic 1,882,900 22.8%
American Indian & Alaskan Native Non-Hispanic 15,558 0.2%
Asian Pacific Islander Non-Hispanic 1,046,973 12.7%
Other Non-Hispanic 195,002 2.4%
Hispanic Origin 2,373,304 28.8%
Total Population 8,244,910.
Popular products:
Recent news:
- White Students Turned Away from “Anti-Racism” Seminar for Being White
- Greek PM Warns of "Far-right Threat" in Europe
- The Dark Side of the "Liberation of Europe"
- "Former Republics of the USSR are on their Way to a Nazi Revival", Says Influential Zionist Group
- Mein Kampf: The world’s most dangerous book?
- Xenophobia Rising: Rome Removes Africans from Refugee Centre Besieged by Nationalists
- "If Jews Leave, Europe will Face Economic Disaster", Jewish Leader Warns
- Angry, White and Proud: New Documentary on English Nationalism (VIDEO)
- Golden Dawn Leadership to Stand Trial on Hitler’s Birthday
- Wreck of Kriegsmarine U-boat Located in Java Sea
- Germany’s Biggest Anti-Racism Crusader Pleads Guilty to Child Porn
- Dutch "Multicultural" Students Resist Holocaust Education
- In Germany, Fanta Ad that "Forgets Evil Nazi Past" is Pulled
- Dutch Police Investigate Sale of Soap Supposedly Made From Jewish Holocaust Victims’ Remains
- In London, Teacher Fined For Posting Hitler Picture With Words "You Were Right"
- Falsely Accused Czech Publishers of Adolf Hitler Speeches Seek Compensation
- Race Riots Coming to Toledo: National Socialists Plan Return for Demonstration after a Decade
- VIDEO: Nationalists Confront Antifa Protesters at Arizona State University
- Italians are Resisting Mass Non-White Immigration
- "Jews using Holocaust to Suck the Blood of Germans," Egypt TV Host Says (VIDEO)
- UK: "This Flat is for Blacks Only": Shocking Racist Campaign to Force White Mum Out of Home
- Norway Deports Record Number of Muslim Immigrants
- Italian Anti-Immigration Rally Draws Thousands of Nationalists in Rome
- Anti-Semitism Spreading Across Europe, Says Study
- The Witch Hunt Continues: Ex-SS Medic, 94, Charged with Mass Murder against Jews


